If Aerosensor is not able to connect to the aerosensor updater then it is likely the USB-C cable is power only, not power + data. Try a different cable.
We have also noticed that USB-C to USB-C chargers don’t work for updater for this reason.

Documentation


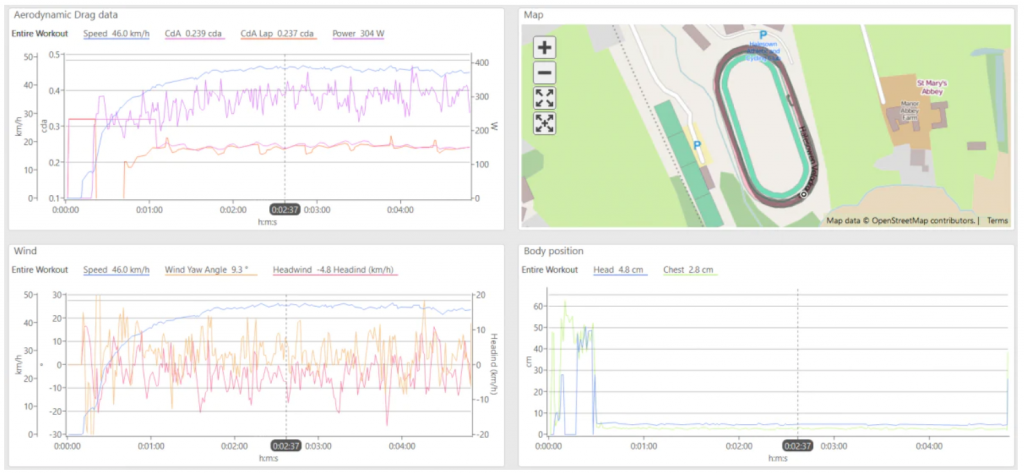
The following screenshots show various components of the aeroportal webpage.
Analysis page:

File Menu:

Open Runs:

Once you have paired your Garmin account and have some files available on our server, you can view your runs. If needed, you can refer to the screenshots in Layout and Account Setup.

Note: You can use the Group by Sessions slider to display runs based on session. You can also open all runs belonging to a session directly from the Sessions tab in the file menu.


The following screenshots show various components of the aeroportal webpage.
Analysis page:
File Menu:
Open Runs:
Once you have paired your Garmin account and have some files available on our server, you can view your runs. If needed, you can refer to the screenshots in Layout and Account Setup.
Note: You can use the Group by Sessions slider to display runs based on session. You can also open all runs belonging to a session directly from the Sessions tab in the file menu.